Breaking Down an Automation Mesh Job
I found myself debugging a very specific issue with a job running on AAP 2.2 using automation mesh. Since it wasn't easy to reproduce in another environment, I setup a brand new instance with the same mesh topology and dug deeper into how these jobs are executed.
How is the execution node chosen?
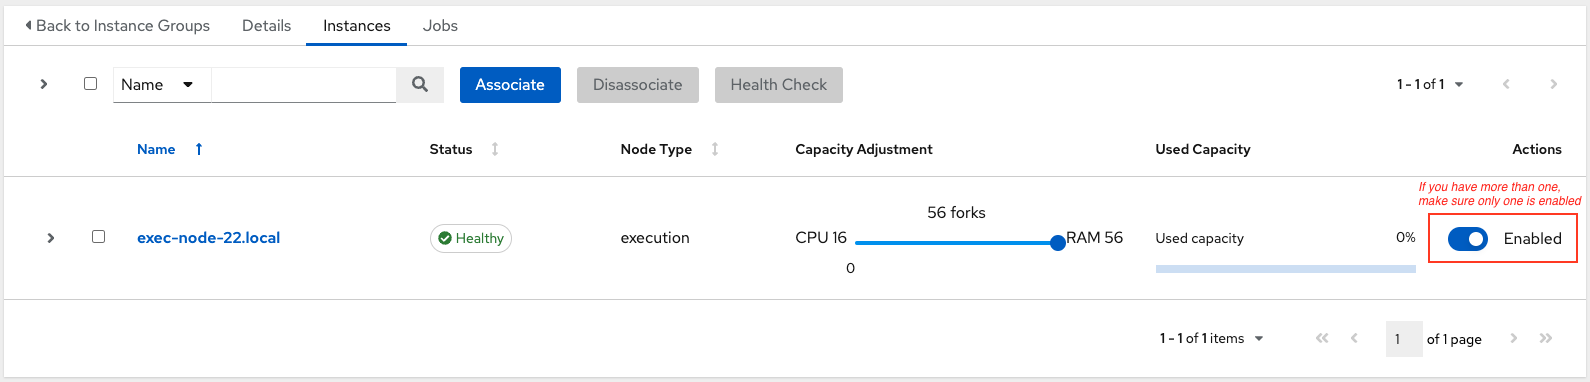
For a non-containerized environment, the instance group will determine the execution node which will receive the job. If you have multiple nodes in the instance group, the scheduler algorithm will pick one. To troubleshoot job execution specifics, I recommend isolating a particular execution node by disabling all but one in the group.
Connect to the execution node
To observe the job launch, first connect to the execution node itself and become the awx user. As the awx user we can leverage the receptorctl CLI to understand what happens on when a job is scheduled on this node. Follow the steps below to get an idea of your setup:
Check the receptor status
receptorctl --socket /var/run/awx-receptor/receptor.sock status
Node ID: exec-node-22.local
Version: 1.4.1
System CPU Count: 4
System Memory MiB: 7697

Connection          Cost
controller-22.local 1

Known Node          Known Connections
controller-22.local exec-node-22.local: 1
exec-node-22.local  controller-22.local: 1

Route               Via
controller-22.local controller-22.local

Node                Service   Type       Last Seen             Tags
exec-node-22.local  control   StreamTLS  2023-09-08 16:24:28   {'type': 'Control Service'}
controller-22.local control   StreamTLS  2023-09-08 16:24:04   {'type': 'Control Service'}

Node                Secure Work Types
exec-node-22.local  ansible-runner
controller-22.local local, kubernetes-runtime-auth, kubernetes-incluster-auth
List running jobs
receptorctl --socket /var/run/awx-receptor/receptor.sock work list
If no jobs are running, this will be empty -> we will come back to this
Create a dummy job
To troubleshoot, we need a job that will run for enough time to allow us to dig around. For that, I simply created a "sleep" playbook. If you are looking to understand what the inner workings of a playbook does, this is not the post for you - I am focused on the execution of a job. See my sleep playbook below:
---
- name: Sleep and wait to debug job mechanics
  hosts: localhost
  gather_facts: false

  tasks:
    - name: Debug hostvars
      ansible.builtin.pause:
        minutes: "{{ pause_minutes }}" # hardcode this if desired
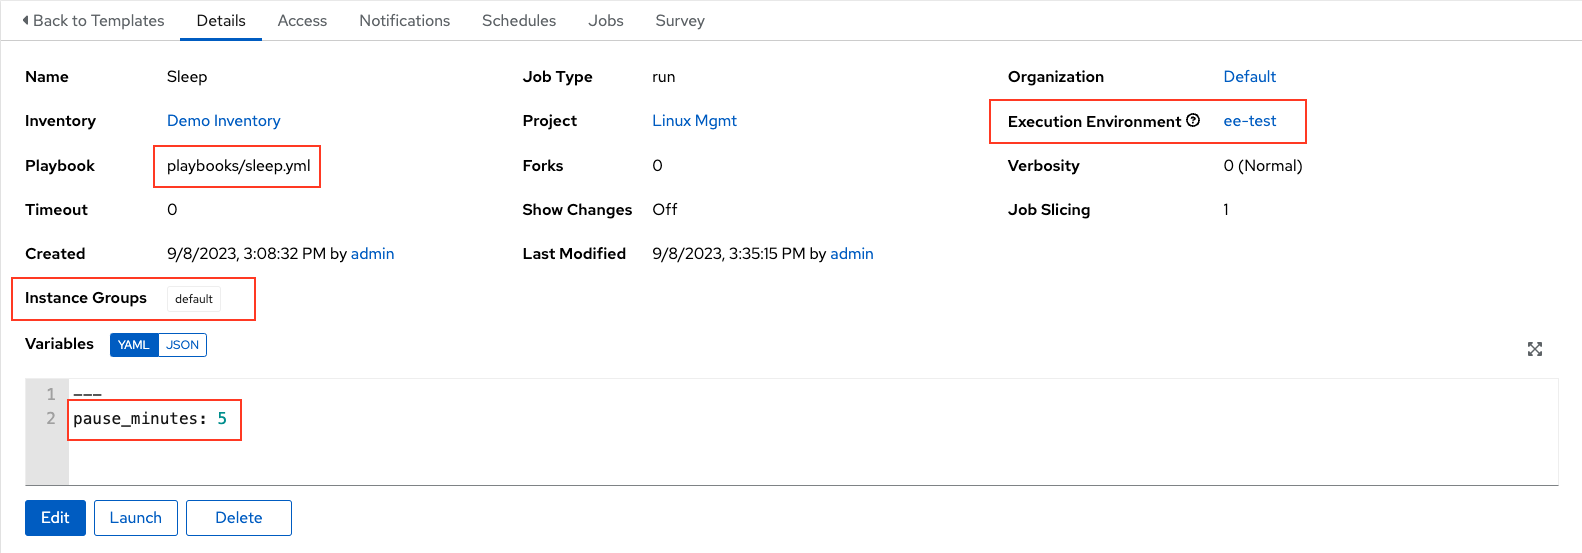
Next, I created a job template in my AAP instance and configured the instance group as well as the execution environment image I wanted to inspect. Below is an snapshot of the job template:
Observe the job
While connected to the execution node, launch the job template from your controller instance. Once the job has begun running, use the following commands to observe the execution:
Get the current receptor jobs
receptorctl --socket /var/run/awx-receptor/receptor.sock work list
{
  "W38yj29E": {
      "Detail": "Running: PID 83967",
      "ExtraData": {
          "Params": "worker --private-data-dir=/tmp/awx_8_caha6f0r --delete",
          "Pid": 83959
      },
      "State": 1,
      "StateName": "Running",
      "StdoutSize": 64726,
      "WorkType": "ansible-runner"
  }
}
Follow the job of interest
receptorctl --socket /var/run/awx-receptor/receptor.sock work results W38yj29E
This will follow the job execution and the output will be live, but the first object is what I am looking for
{
    "status": "starting",
    "runner_ident": "8",
    "command":
    [
        "podman",
        "run",
        "--rm",
        "--tty",
        "--interactive",
        "--workdir",
        "/runner/project",
        "-v",
        "/tmp/awx_8_caha6f0r/:/runner/:Z",
        "-v",
        "/etc/pki/ca-trust/:/etc/pki/ca-trust/:O",
        "-v",
        "/usr/share/pki/:/usr/share/pki/:O",
        "--env-file",
        "/tmp/awx_8_caha6f0r/artifacts/8/env.list",
        "--quiet",
        "--name",
        "ansible_runner_8",
        "--user=root",
        "--network",
        "slirp4netns:enable_ipv6=true",
        "quay.io/zleblanc/ee-rhel8-aap22-supported",
        "ansible-playbook",
        "-u",
        "root",
        "-i",
        "/runner/inventory/hosts",
        "-e",
        "@/runner/env/extravars",
        "playbooks/sleep.yml"
    ],
    "env":
    {
        "ANSIBLE_UNSAFE_WRITES": "1",
        "AWX_ISOLATED_DATA_DIR": "/runner/artifacts/8",
        "ANSIBLE_FORCE_COLOR": "True",
        "ANSIBLE_HOST_KEY_CHECKING": "False",
        "ANSIBLE_INVENTORY_UNPARSED_FAILED": "True",
        "ANSIBLE_PARAMIKO_RECORD_HOST_KEYS": "False",
        "AWX_PRIVATE_DATA_DIR": "/tmp/awx_8_caha6f0r",
        "JOB_ID": "8",
        "INVENTORY_ID": "1",
        "PROJECT_REVISION": "b313226fcd4a7b56e56a2bd847de77aa7f74e78b",
        "ANSIBLE_RETRY_FILES_ENABLED": "False",
        "MAX_EVENT_RES": "700000",
        "AWX_HOST": "https://towerhost",
        "ANSIBLE_SSH_CONTROL_PATH_DIR": "/runner/cp",
        "ANSIBLE_COLLECTIONS_PATHS": "/runner/requirements_collections:~/.ansible/collections:/usr/share/ansible/collections",
        "ANSIBLE_ROLES_PATH": "/runner/requirements_roles:~/.ansible/roles:/usr/share/ansible/roles:/etc/ansible/roles",
        "ANSIBLE_CALLBACK_PLUGINS": "/runner/artifacts/8/callback",
        "ANSIBLE_STDOUT_CALLBACK": "awx_display",
        "RUNNER_OMIT_EVENTS": "False",
        "RUNNER_ONLY_FAILED_EVENTS": "False"
    },
    "cwd": "/runner/project"
}
So that is a lot of information, but sometimes it's nice to know exactly what is happening when you kick off an automation job. In my case, I was particularly focused on understand where the callback plugins were being source. By going through this process, I was able to observe the ANSIBLE_CALLBACK_PLUGINS environment variable set to /runner/artifacts/8/callback.
Additional Troubleshooting Steps
My next step was jump into the running execution environment and see what was in that directory. Below are the commands I ran:
podman ps
used to get the name of my runner pod
CONTAINER ID  IMAGE                                             ...       NAMES
ed71eecfa3a6  quay.io/zleblanc/ee-rhel8-aap22-supported:latest  ...       ansible_runner_8
podman exec ansible_runner_8 ls /runner/artifacts/8/callback
used to list the callback directories
__init__.py
__pycache__
awx_display.py
With this information, I can compare environments and better understand why a callback plugin error is preventing jobs from running via the controller.
General Usage
I was focused on a specific error - determining why the awx_display callback plugin was causing issues in my environment. However, this troubleshooting process can help you get to the root cause of any issues related to job executions in automation mesh... or maybe you just wanted to get a better grasp on the nuts and bolts (I know I did). Best of luck troubleshooting 😄